Which teams are the biggest #Superugby “predators”?
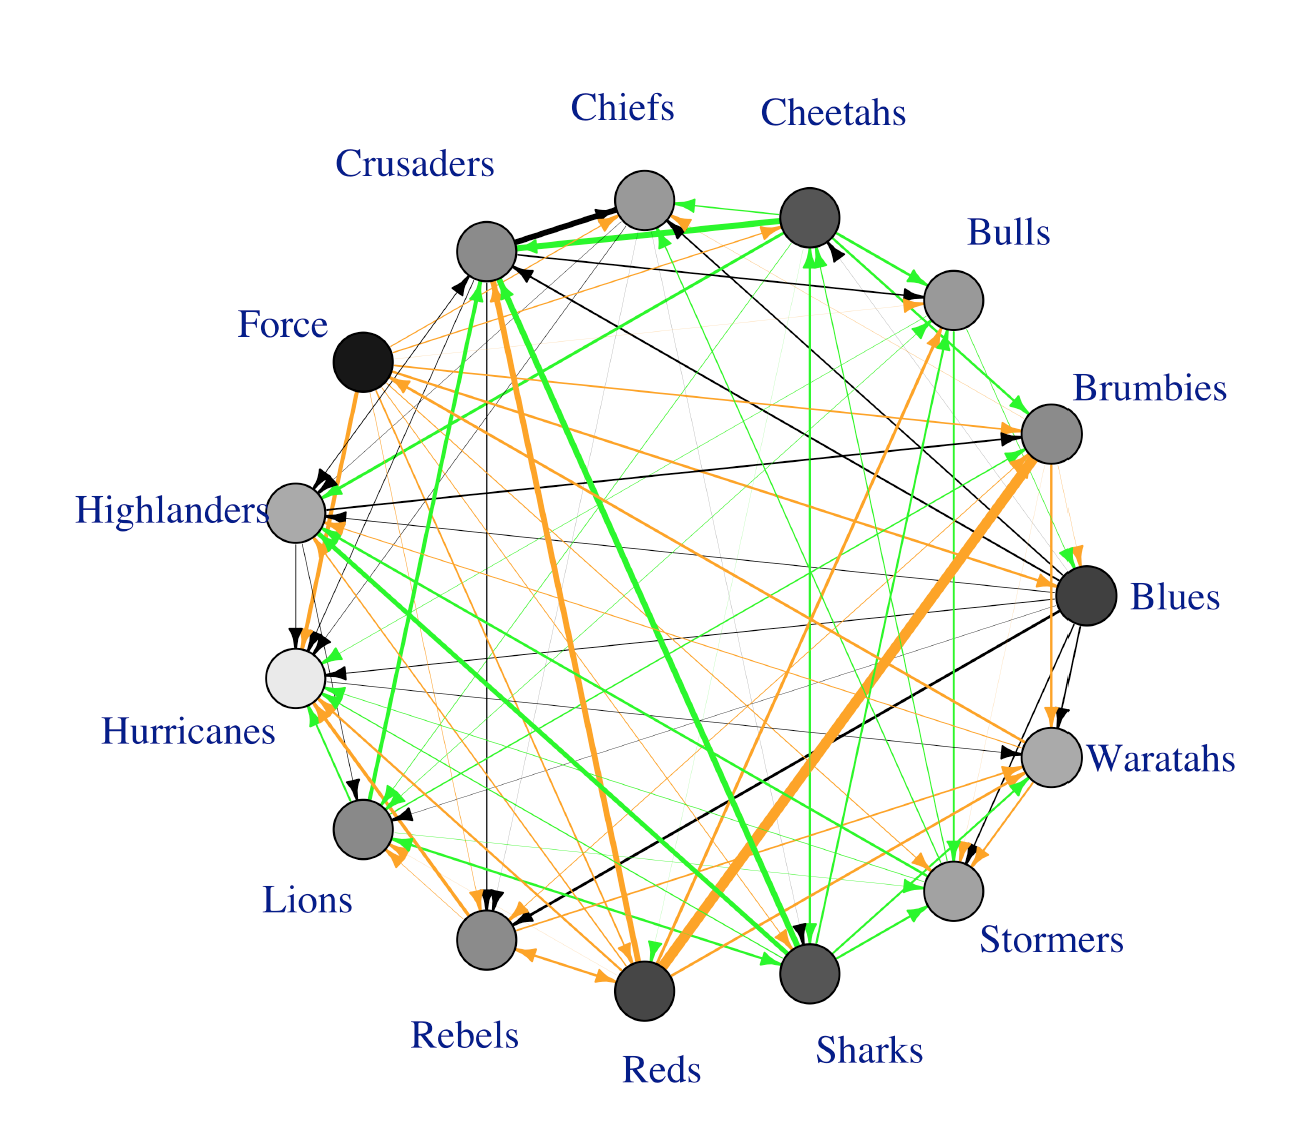
With the league phase of the competition drawing to a close, we ask the obvious question: what would this year’s Super 15 competition look like as network of predator-prey relationships? The plot below summarizes the competition so far. Arrows represent the flow of points, so the arrows point from losers, the “prey”, to winners, the “predators”. The top teams, like the Hurricanes and Highlanders, will have more arrows pointing in to them. The thickness of the lines tells you the size of the victories. The Brumbies have been feasting on the Reds, for example. The colours show what country the loser came from. The Stormers, for example, have many wins but these are mostly against local opposition. Finally the circle representing each team is shaded according to points differentials, with lighter colours indicating a better points difference. The Force’s colour is the same as their fortune this year, dark. A picture tells a thousand words!
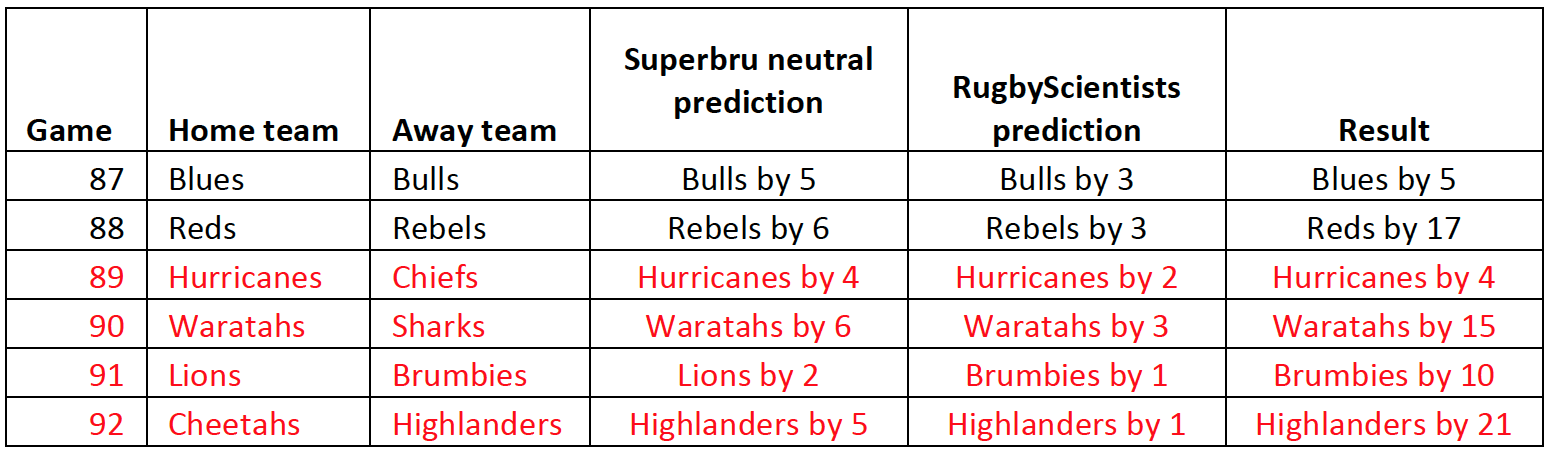
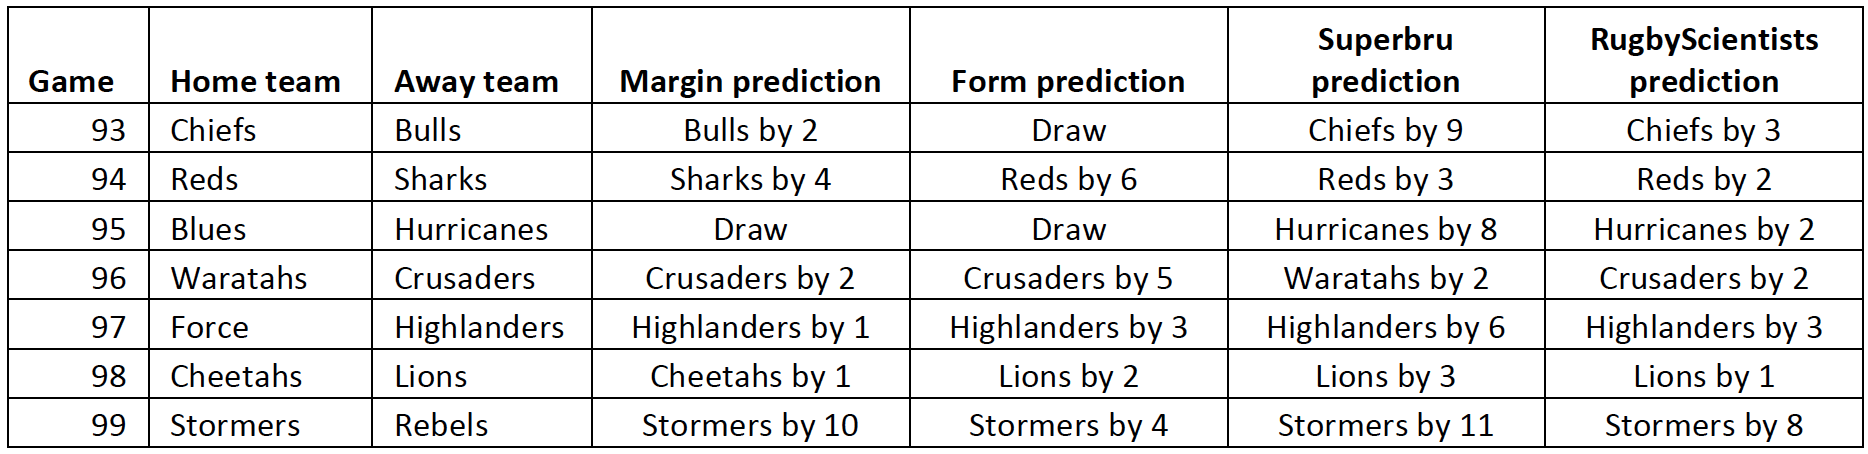
Here are the outcomes for last weekend followed by predictions for the weekend ahead.