Runs of “form” in this year’s #Superugby competition
Last week saw our model get five out of weekend’s seven games correct, roughly the same as the Superbru average. It also saw only 3 home teams winning, compared to 4 away teams, remembering we’re keeping an eye on that statistic. This week we thought we’d look at some more data visualization using networks. The figures below show the rounds in which each team in the competition won. A line between a team and a number indicates that the team won in that round, and we’ve divided teams up by their country to make it easier to see what’s going on. No Australian team won in round 9, and no South African team won in round 14, for example. Most teams pick up a few wins here and there, but these tend to be scattered throughout the competition rather than concentrated in a run of “form”. An exception is the Sharks: they put together a run in rounds 5, 6 and 7 but have fallen away badly since then.

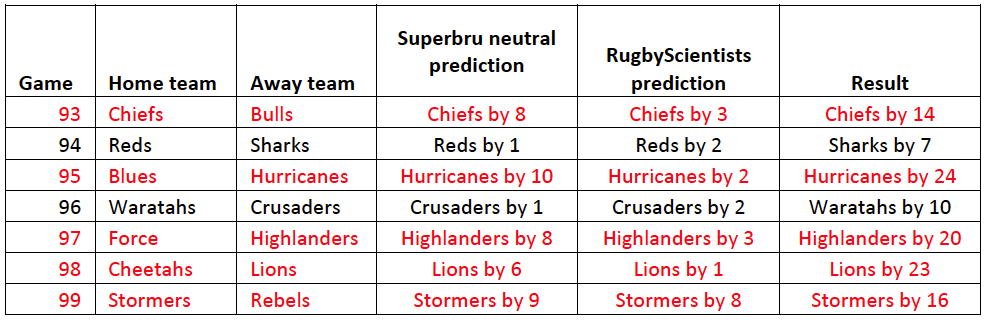
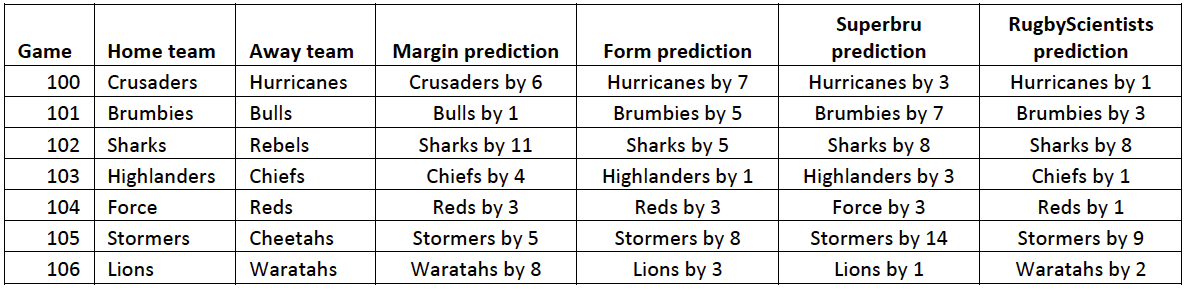
Here are the outcomes for last weekend followed by predictions for the weekend ahead. Only the Stormers and Sharks are unanimously tipped to win, otherwise looks like a weekend of close games!